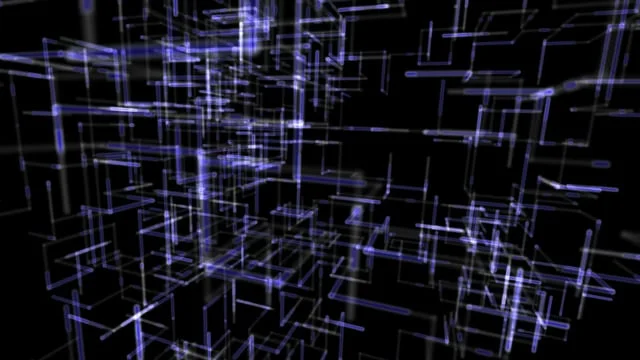
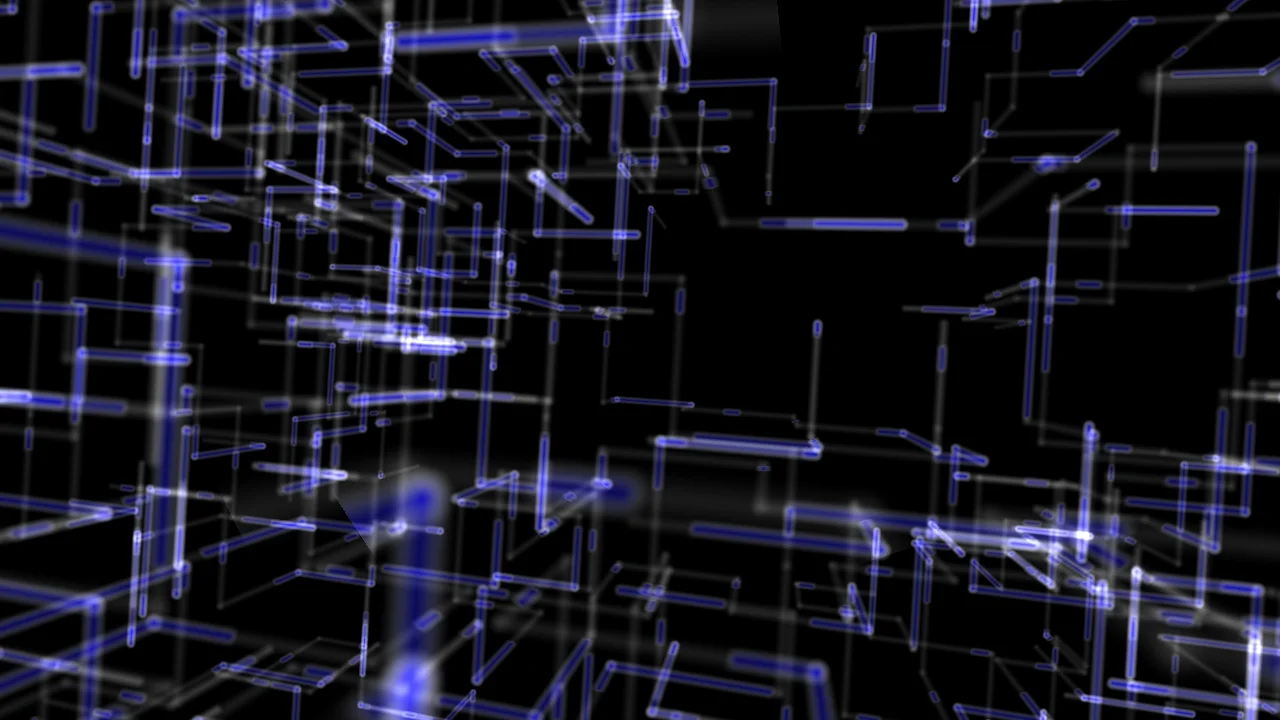
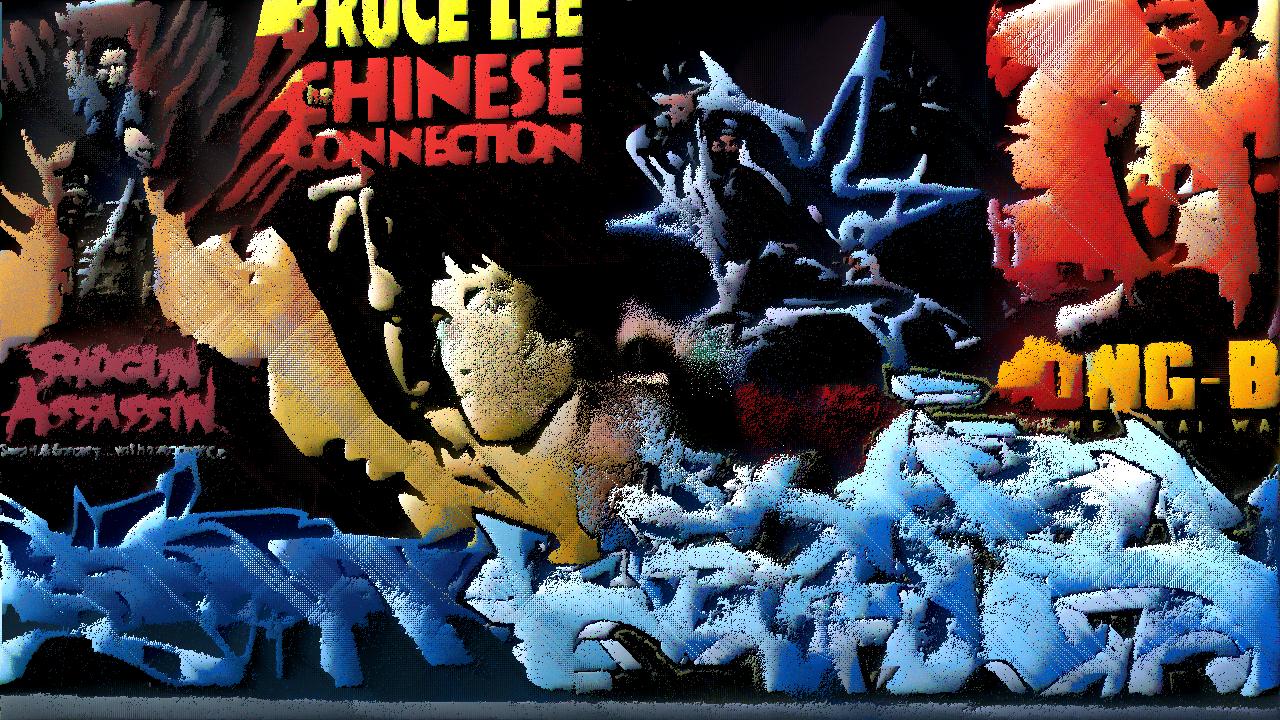
Quick study implementing volumetric lines and depth of field. Animation happens on the fragment shader.
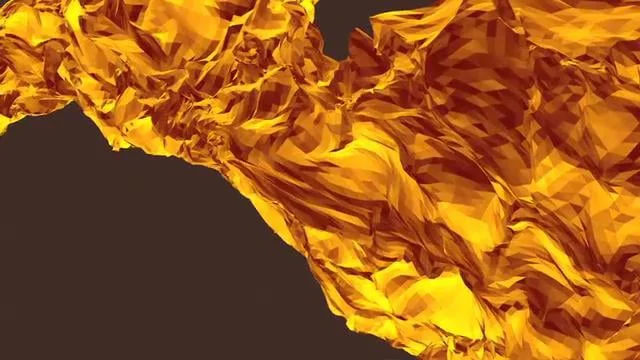
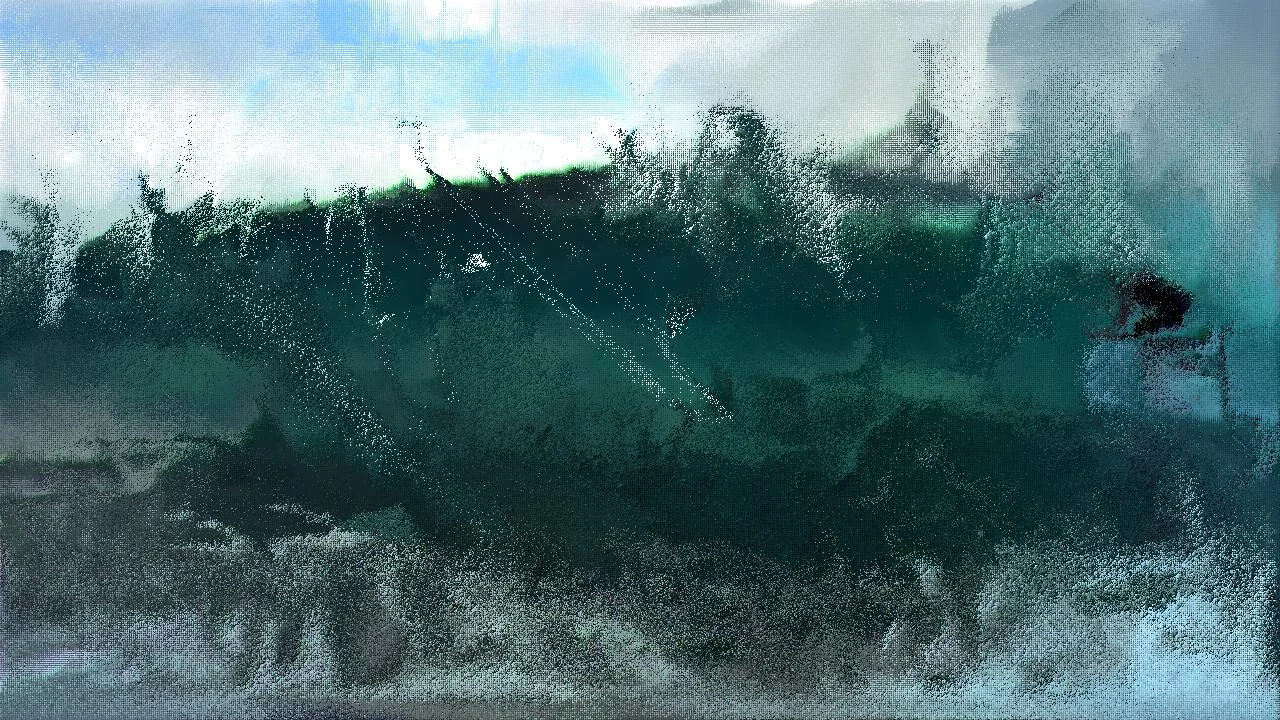
Transformer is a free project a large scale generative visual combining dynamic displacement and realtime particle simulation. Parameters are blended in a defined value space randomly and create unique transformations. A gpu particle system allows the realtime animation of nearly half a million triangles attached to a dynamic grid. The strength of the different forces of the animation can be manipulated to shape different visuals.
tree accesses the source code of a web domain through it’s url and transforms the syntactic structure of the web site into a tree structure represented by an image. this image illustrates a tree with trunk, branches and ramifications. first each tree is initialized, than all html links are detected, chronologically saved and finally displayed. the first tree corresponds to the domain; according to the syntax of the web site each further tree that builds up represents a sub page including all existing elements. the color of these trees reflects the color values of the domain and its sub pages.
parallel to the graphic conversion, a permutation of the source code into midi data is generated analogous to the evolving trees, their branches and ramifications. any midi compatible hard- or software can be triggered by these midi data. the structure of any url can be visualized and transformed into sound. the aesthetic is not arbitrary or accidental, rather each url/domain determines the variation of trees in form and color.
tree is a translation program. the simulation of real space by software as a starting point and basic question characterizes the search for an algorithm (design specification) which illustrates a real tree. tree interprets each html page as a design specification; the html space determines the algorithm and generates the visual world of the translation beyond simulation. tree has been exhibited at the club transmediale berlin and the sonar matica in barcelona.
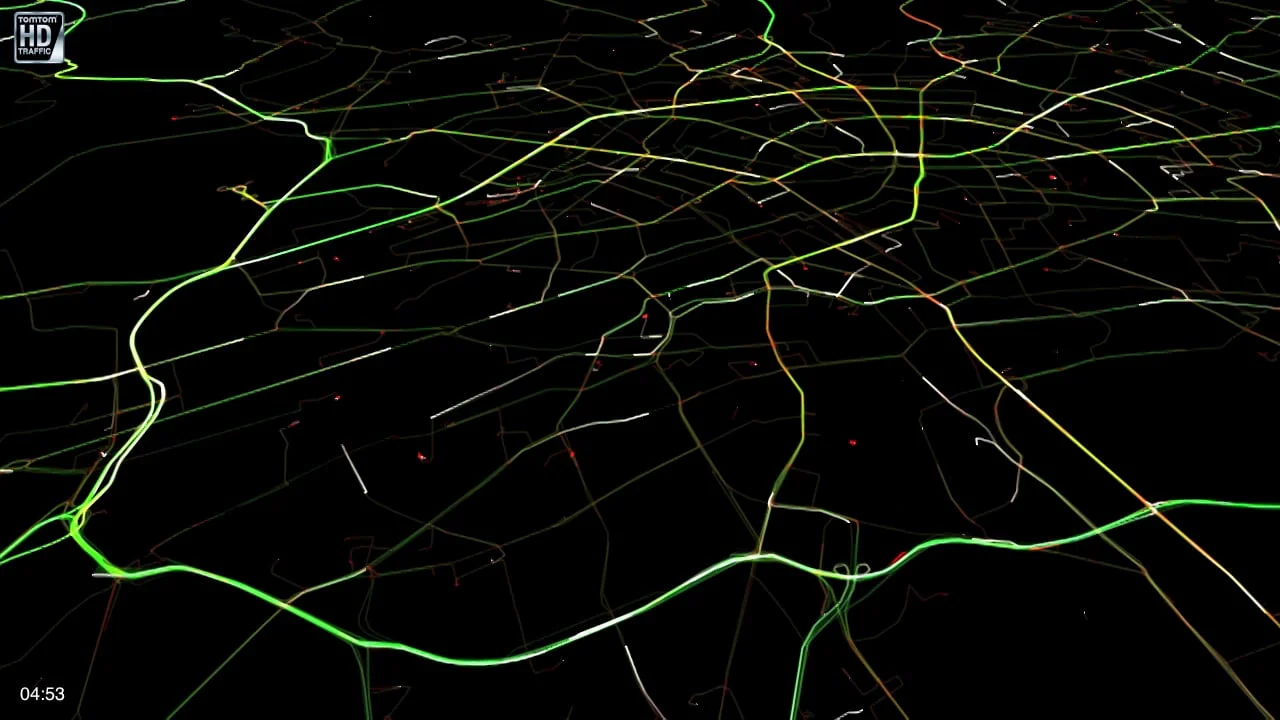
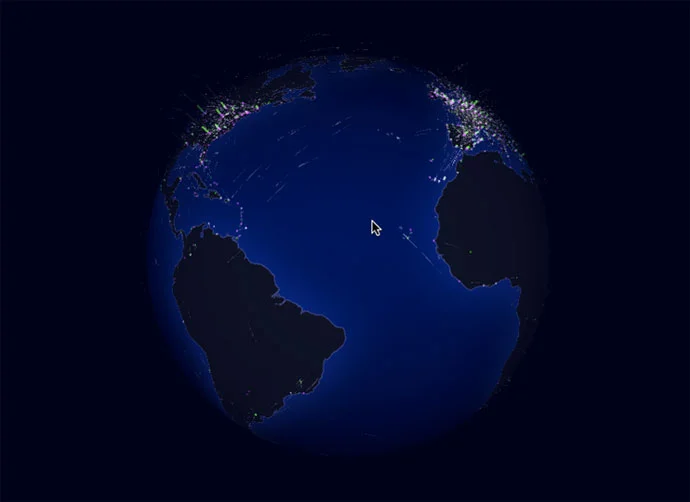
Flightplans in pdf format of the 3 big airline networks have been parsed into a database and visualized by mapping the flights on a virtual globe based on there time and position. The result shows the main traffic areas, change of the flight densities according to the current time and reveals interesting patterns in the daily flight traffic.